| The debug recording (DR) tool can be used to capture media streams, networking and signaling traffic, and other internal board information on gateways (MediaPacks, Mediants, TrunkPacks, etc.) using firmware version 5.2.
The client used to capture the DR packets is version 0.99.4 of the Wireshark program (which can be downloaded from http://www.wireshark.org). AudioCodes proprietary plug-ins (supplied in the software kit) must be placed in the 'plugins' folder of the installed Wireshark version (typically, C:\Program Files\Wireshark\plugins\0.99.4\) to extract the DR packets. The plug-ins are not required for capturing the DR trace.
- In the URL field, append the suffix 'FAE' (case-sensitive) to the IP address of the gateway (e.g. http://10.1.229.17/FAE). The screen displayed below will open (username and password are the same as when logging into the gateway's GUI; defaults: Admin/Admin).

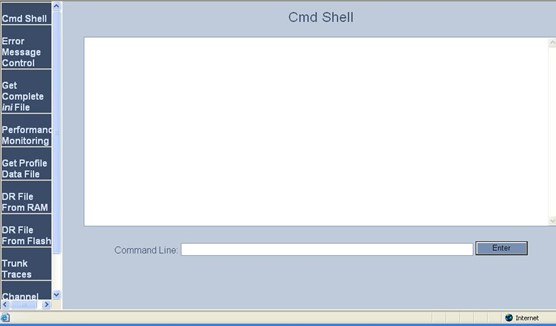
Select the 'Cmd Shell' tab and the Command Line Interface (CLI) will appear:

To activate the DR via the CLI, at the prompt type the following commands:
- DR (accesses the Debug Recording directory)
- STOP (terminates all active recordings, if any)
- RTR ALL (removes all previous recording rules, if any)
- RT ALL (removes all DR targets from the list; for example client IP addresses)
- AIT <IP address of the target> (defines the IP address of the PC running Wireshark; e.g. AIT 10.1.229.10)
To capture DSP traces (internal DSP packets, RTP, RTCP, T.38, events and syslog), at the prompt type the following commands:
- ANCT ALL-WITH-PCM 10
- START
To capture SIP messages via Wireshark, at the prompt type the following command:
- AIPCT N2H SIP (sends SIP information to Wireshark)
- START
- To collect the DR messages, open Wireshark program and begin test call.
- Save trace file and send to AudioCodes for analysis.
|